November 2025
Upgrades to screener: New technical timeframes
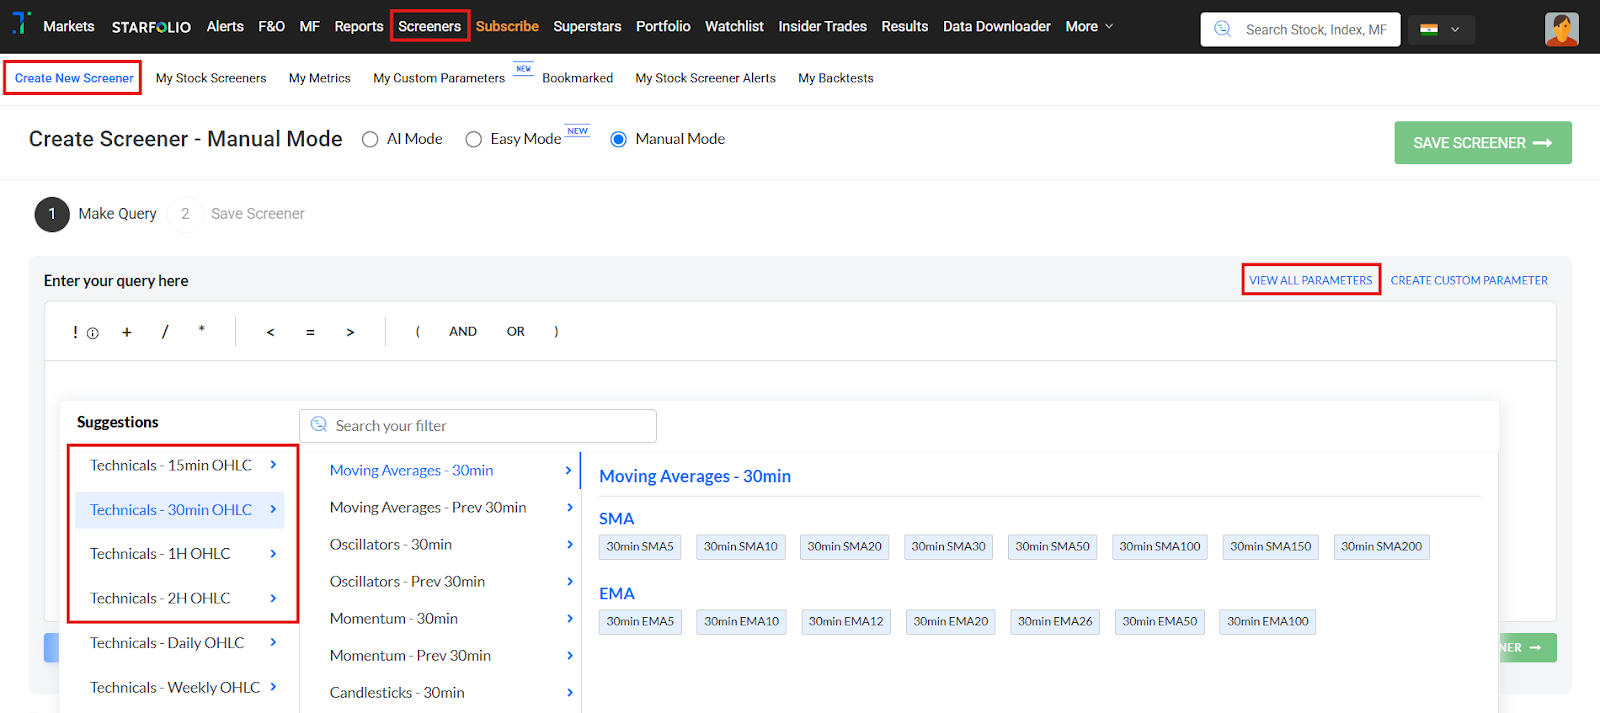
You asked us for more flexibility in your technical analysis. Here it is. We’ve added new technical parameters for 15 mins, 30 mins, 1Hr, and 2Hr OHLC timeframes in the screener product. For sharper intraday and short term setups.
To try them out:
1. Go to the Screeners page and click Create New Screener
2. Click on View All Parameters
3. Scroll down to find the new Technical 15 mins, 30 mins, 1Hr & 2Hr OHLC timeframes, as shown in the image below.
------------------------------------------------------------------------------------------------------------------------------------------
Trendlyne Baskets
Three new high-performing baskets have launched on Starfolio, curated for different investing styles.
1. Momentum 7: for those who love speed and growth, built using our upgraded Momentum score.
2. Dividend 7: steady set of high-performing, dividend-paying stocks.
3. Select 5: our signature basket of five standout stocks for long-term investing.
You can explore all three Trendlyne Baskets here: https://starfolio.trendlyne.com/manager/trendlyne/.

------------------------------------------------------------------------------------------------------------------------------------------
Import your Groww portfolio
No more manual uploads! You can now directly import your Groww portfolio into Trendlyne with a couple of clicks. Track, analyze and manage your holdings seamlessly.
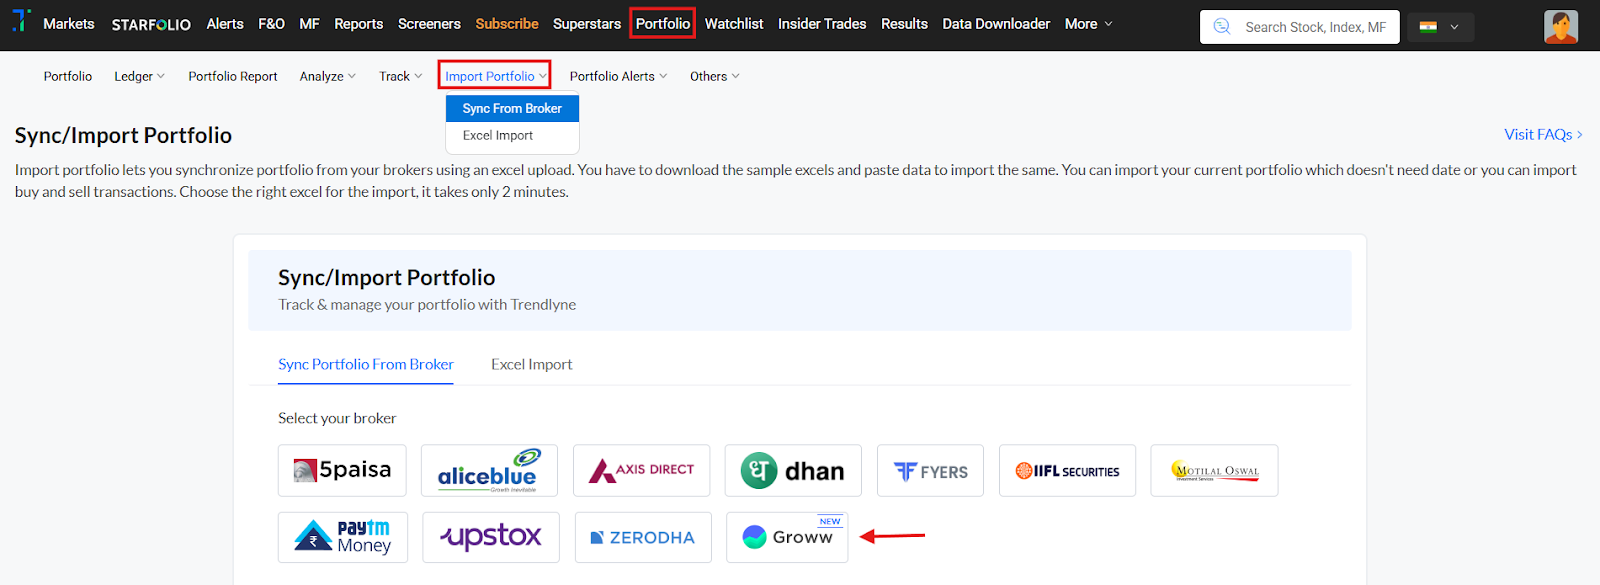
Read the quick FAQ here: https://help.trendlyne.com/support/solutions/articles/84000384363-how-can-i-import-portfolios-via-brokerage-
------------------------------------------------------------------------------------------------------------------------------------------
Individual Superstar alerts
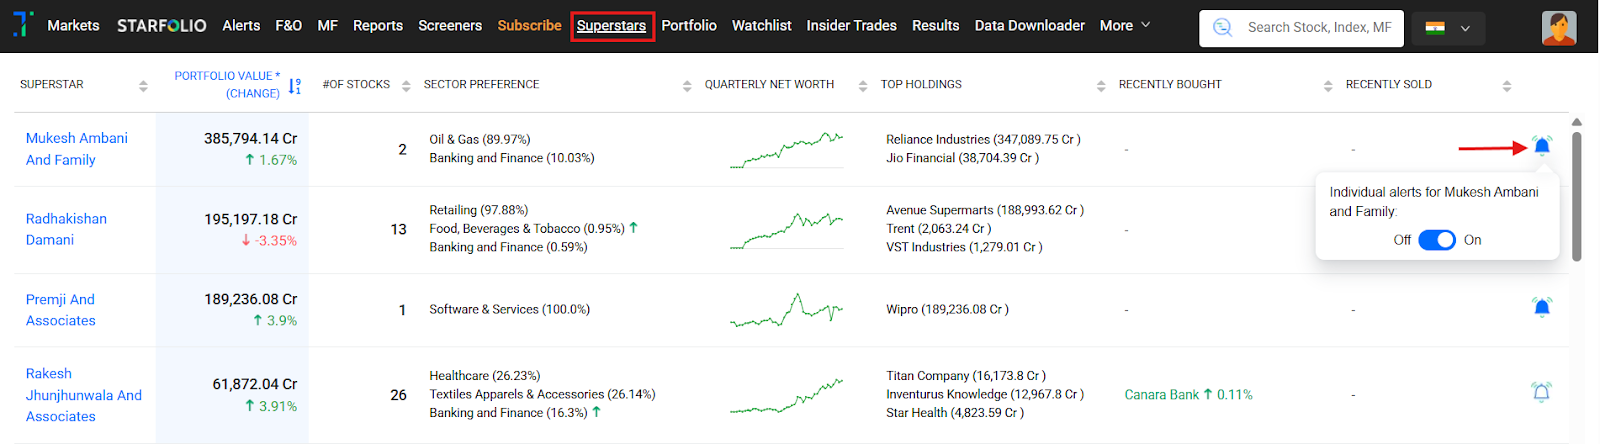
Follow your favorite superstar, and never miss their next move. You can now set instant alerts for individual or institutional superstars so you follow just your preferred investors.
How to set it up:
From the Superstar portfolio section, click Add All Superstar Alerts → select Individual Superstar Alerts or click on the bell icon in the table.

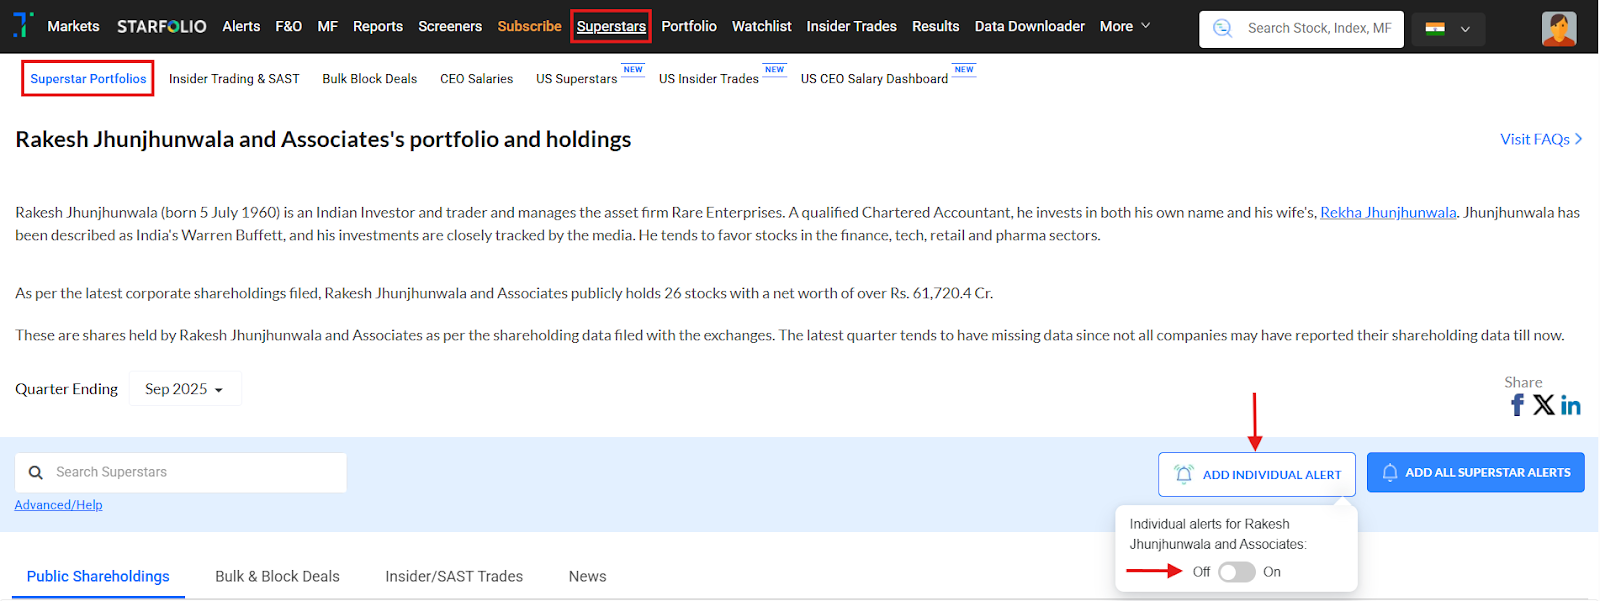
B. Or from an Individual superstar page
Click Add Individual Alert, and use the toggle to enable or disable alerts for that superstar (for example, Rakesh Jhunjhunwala and Associates’s portfolio).
------------------------------------------------------------------------------------------------------------------------------------------
Screener: Easy mode
Discover great stocks in seconds! No complex setup needed. Our new easy stock screener lets you easily filter using fundamental, technical, and comparative parameters in drop down mode, all in one screen.
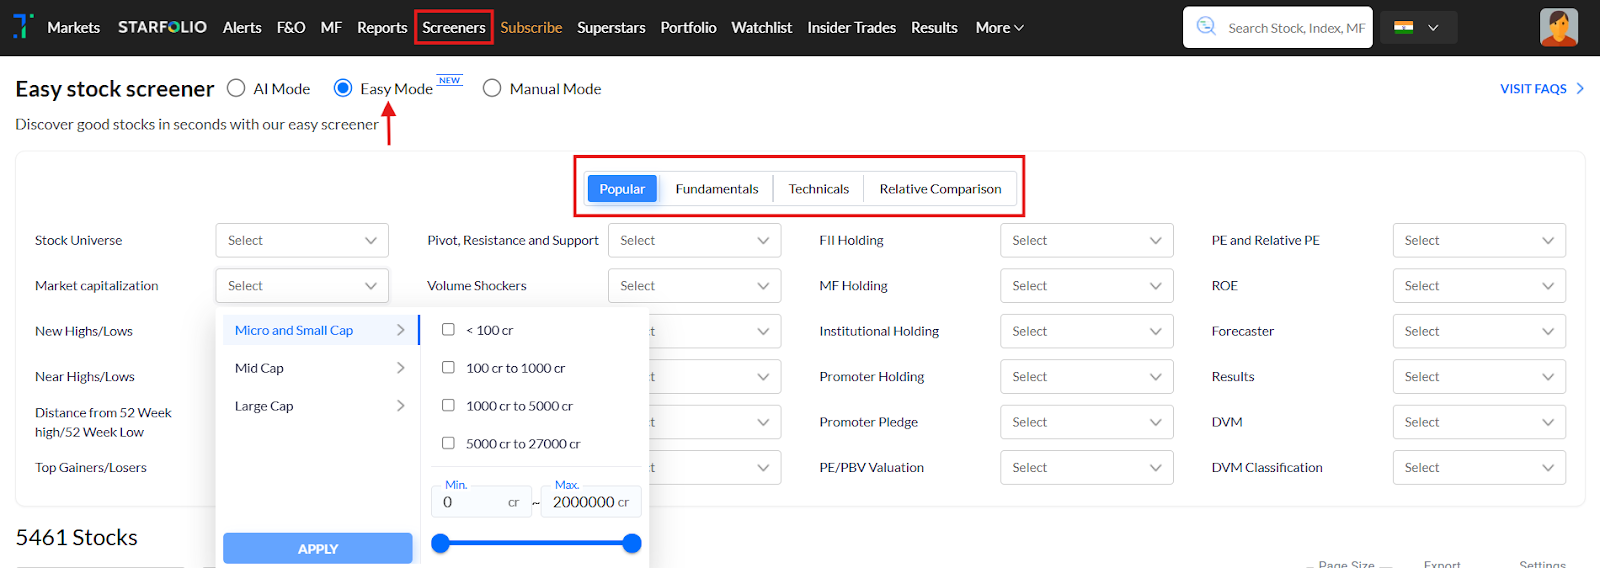
You can access the Screener Easy Mode using this link: https://trendlyne.com/fundamentals/easy-stock-screener/
------------------------------------------------------------------------------------------------------------------------------------------
Follow trades by US politicians
Curious what US lawmakers are buying and selling? Trendlyne’s Politician trades feature lets you follow stock trades by political pros like Nancy Pelosi, Tommy Tuberville, Josh Gottheimer, and more.
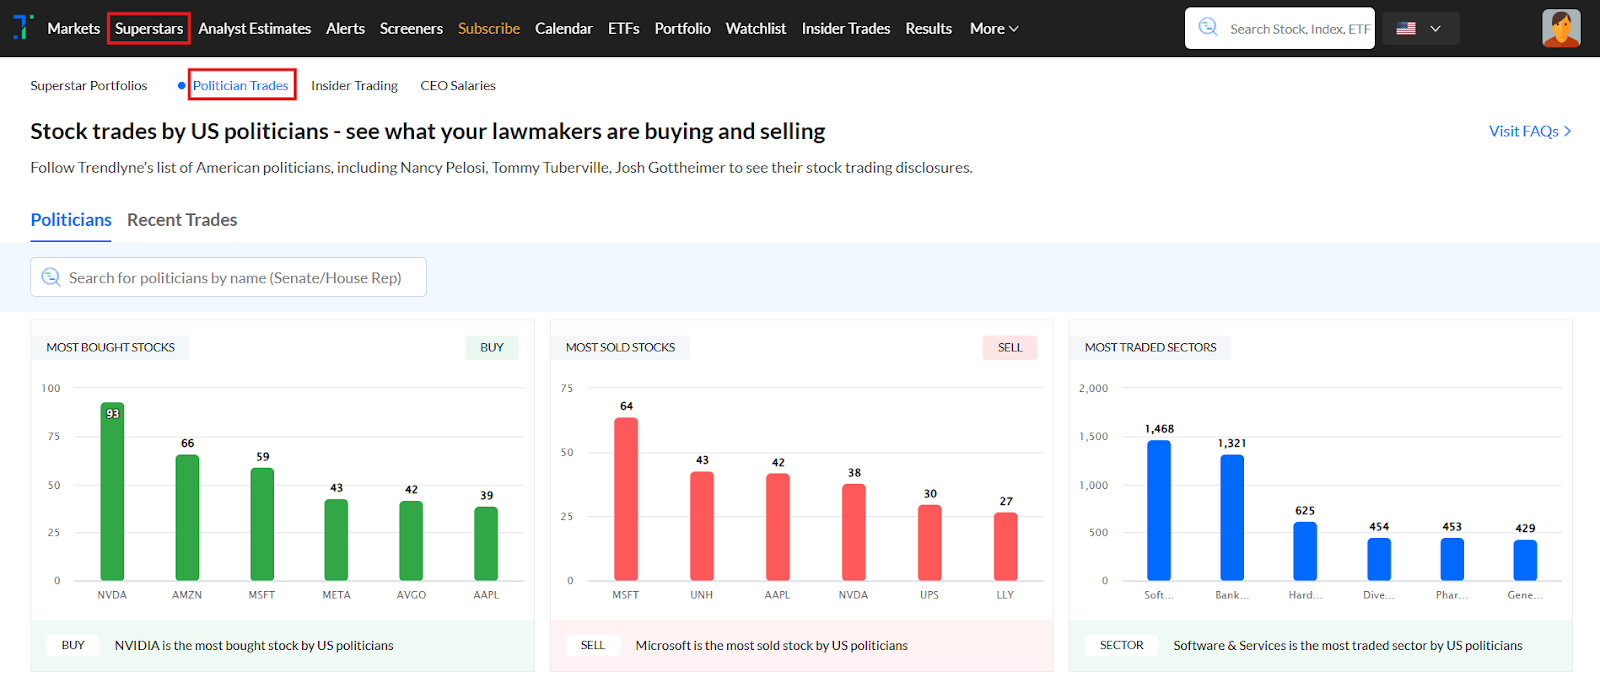
You can access the Politician Trades using the following link: https://us.trendlyne.com/us/politicians/dashboard/.
------------------------------------------------------------------------------------------------------------------------------------------
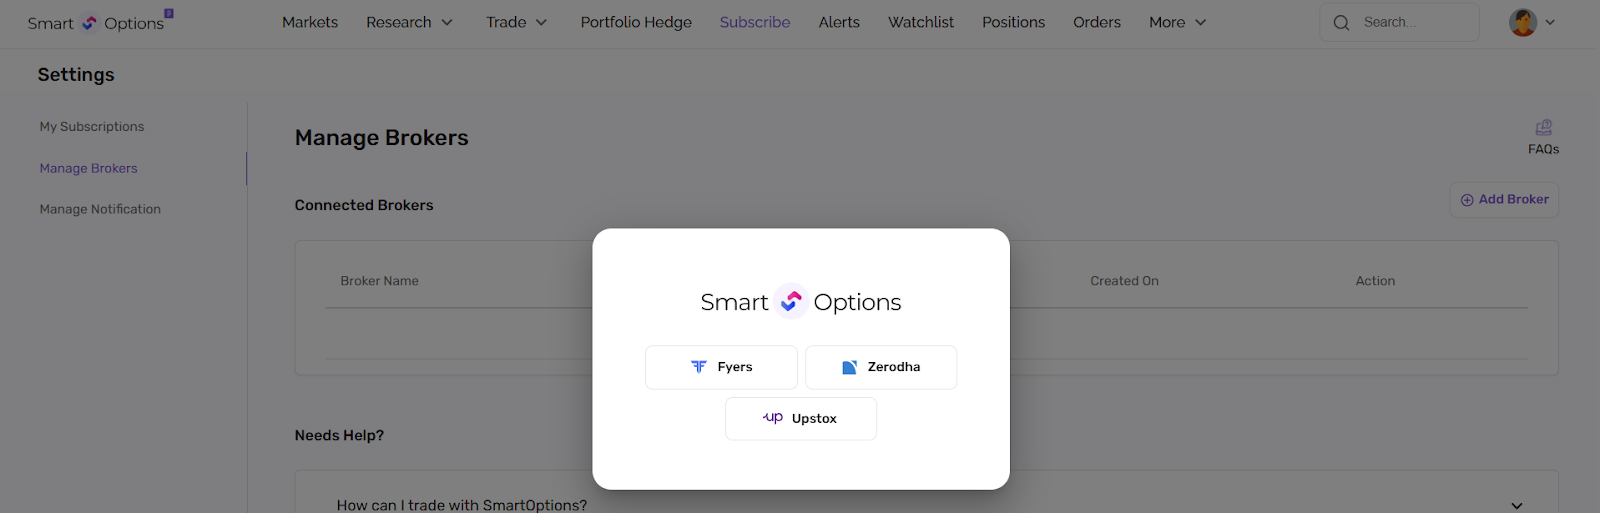
SmartOptions now supports Zerodha & Upstox
Great news for F&O traders – SmartOptions is now integrated with Zerodha and Upstox. Connect your broker, sync positions, analyze and execute orders directly from SmartOptions.
Manage your connected brokers here: https://smartoptions.trendlyne.com/settings/manage-brokers/
Broker Connect FAQs here: https://smartoptions.freshdesk.com/support/solutions/folders/84000349942
------------------------------------------------------------------------------------------------------------------------------------------
Ask AI to optimise your strategy
We are really excited about this one. Meet your new AI strategy assistant on the SmartOptions Strategy Builder.
Once you select a strategy, click Ask AI - Optimise Your Strategy and type your query. The AI gives fast, personalized insights for both simple and complex setups.
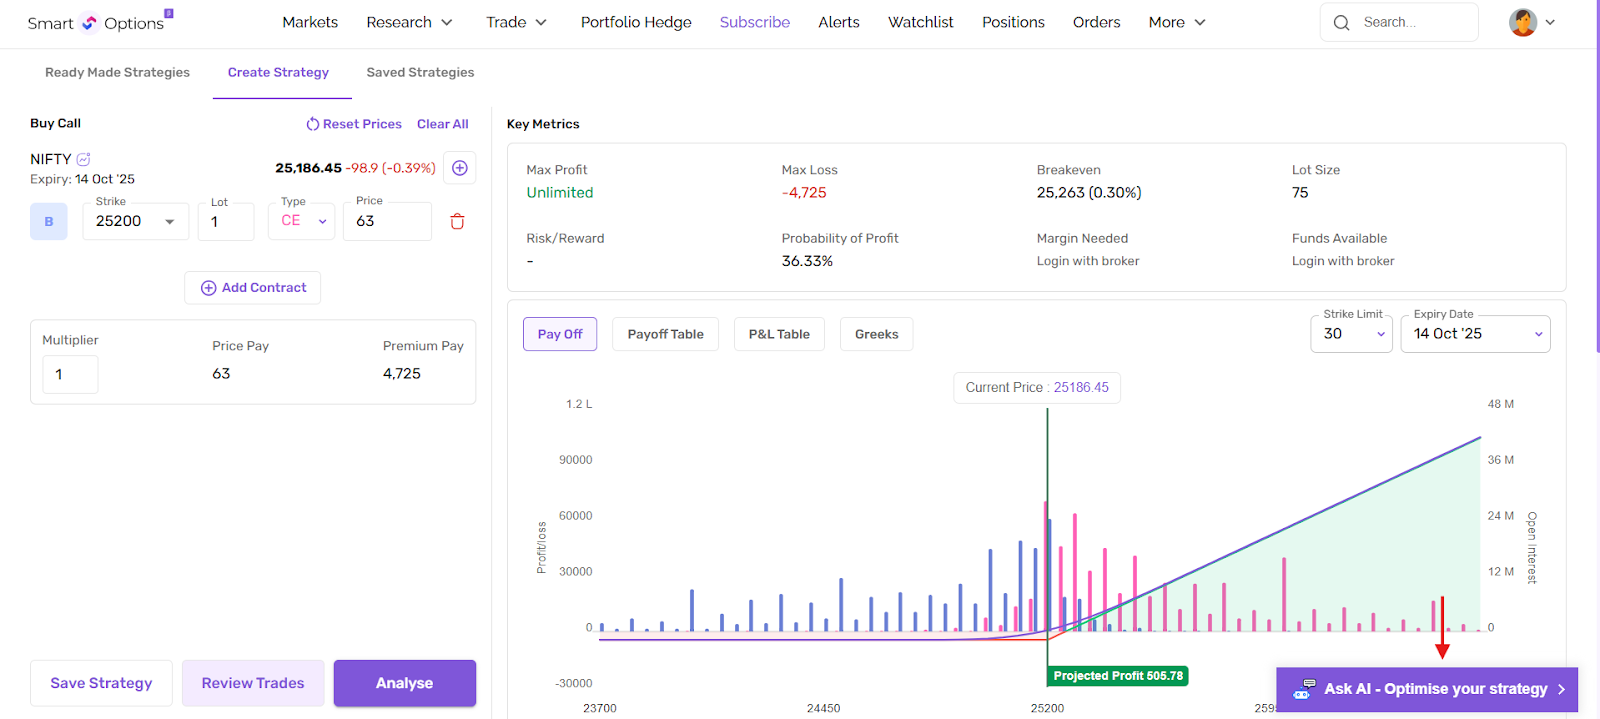
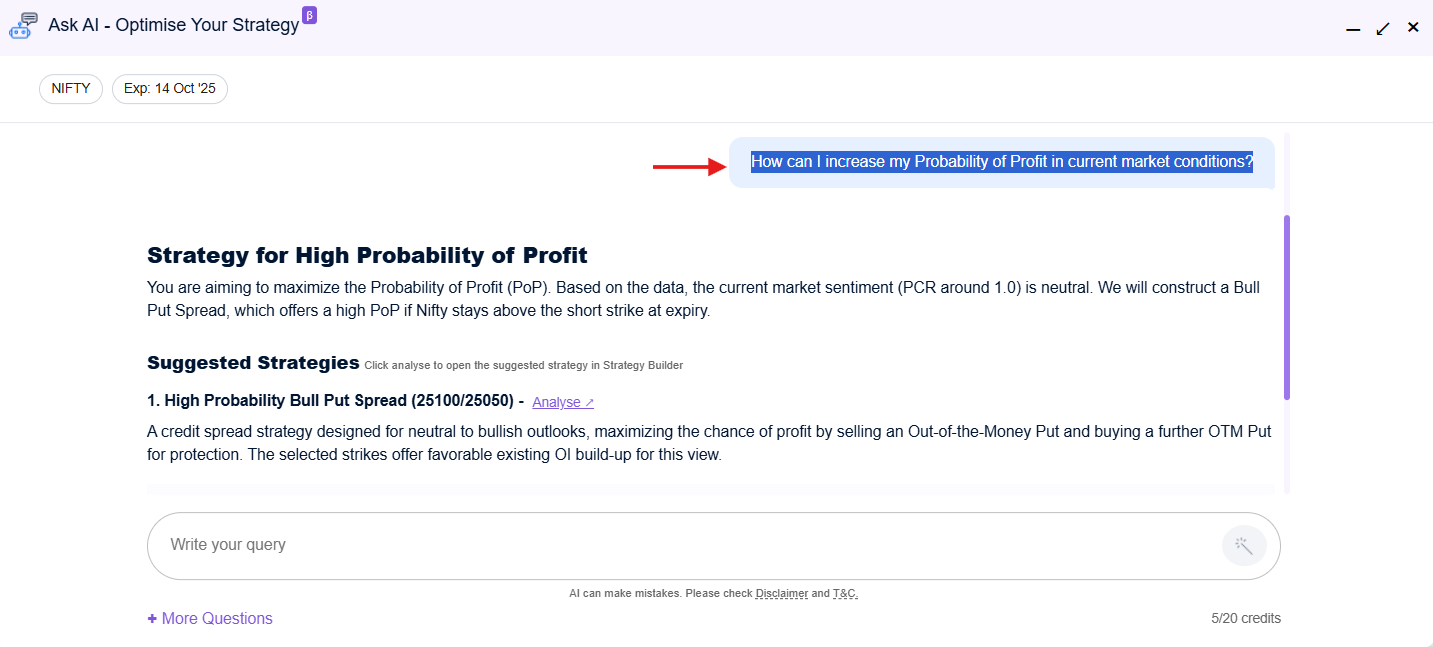
Here’s what it can do:
Create: Suggests strategy ideas for your market view.
Analyze: Explains risks, Greeks, and break-even points in plain English.
Optimize: Recommends strike, margin, and timing tweaks.
Hedge: Sets risk boundaries and helps you protect positions.
------------------------------------------------------------------------------------------------------------------------------------------
July 2025
Screeners with AI mode: You can now build screeners using plain English
Creating stock screeners has just become very easy with Screener AI Mode. This gives you an AI assistant who takes a query you type in plain English and converts it into a working screener.
For example, if you ask the AI for stocks with high ROE and low debt, it will automatically convert your question into a screener query and build the screener for you using the relevant parameters.

You can even paste queries from other platforms - the AI will automatically map them to a working Trendlyne query, using the correct metrics. You can also ask AI to edit any query according to your requirements.
You can access the AI Screener Mode by clicking ‘Create New Screener’ from the Screener section and enabling the AI Mode toggle.
---------------------------------------------------------------------------------------------------------------------------------------------
SmartOptions by Trendlyne – to simplify Futures & Options trading
We spent a year building this. There was no blood, but a lot of sweat and (some) tears. SmartOptions is Trendlyne’s all-in-one platform designed to simplify your Futures and Options (FnO) trading.
It brings together strategy building, analytics, real-time alerts, and broker integration to help you make faster, smarter trading decisions.
QuickOptions: If you're new to options but have a view on the market, QuickOptions shows you strategy ideas in seconds, complete with payoff charts, Greeks, and key insights.
Portfolio Hedge: Simulate a market fall and discover hedging strategies to minimize your loss in your portfolio
Real Time Alerts: Set alerts on LTP, open interest, volume changes, MWPL, or on positions’ P&L. Get instant notifications via email or WhatsApp when your targets are hit.
Strategy Builder: Create multi-leg options strategies, check margin requirements, analyze pay-off, simulate P&L on market movements, analyze Greeks, trade or save them for later use.
Broker Integration: Place trades directly via Zerodha or Fyers within SmartOptions. No switching between tools. More brokers are in the integration phase.
You can also access FnO screeners, OI analytics, and futures heatmap designed to support confident decision-making.

------------------------------------------------------------------------------------------------------------------------------------------
Where are the bulls and bears?: Bullish Bearish Breadth for sectors, industries & indices
Bullish Bearish Breadth gives you insights into market participation across sectors, industries, and indices, with bullish and bearish breakups.

This has two view modes:
1. Equi-Weighted: Every stock has equal weight. This is great for identifying broad-based moves.
2. Market Cap-Weighted: This is the large-cap driven view, ideal for tracking institutional sentiment.
The table has metrics like the percentage of stocks with RSI > 50, MFI > 50, and those trading above SMA 20, 50, and 200, as well as those with SMA 50 > SMA 200.
It also shows the percentage of daily and weekly gainers vs. losers, making it easy to spot whether a sector's
movement is supported by many stocks or just a few.
You can go to Bullish Bearish Breadth via the Sector Dashboard under the Markets page, or directly here: https://trendlyne.com/equity/sector-bullish-bearish-breadth/equi-weighted/
------------------------------------------------------------------------------------------------------------------------------------------
Trendlyne’s Global iOS app
The Global iOS App is now live, giving users seamless access to both the Indian and US markets within a single app. This makes it easier than ever to track, analyze, and manage global investments on the go.
Switching between markets is simple, just tap the hamburger menu, then use the dropdown next to the flag icon to toggle between India and the US.

------------------------------------------------------------------------------------------------------------------------------------------
Trendlyne Excel Connect brings US financial data to Excel & Google sheets
The US version of Trendlyne's Excel Connect is here, which lets you access financial data for any listed US stock directly within Excel or Google Sheets.

With Excel Connect, you can fetch the latest and historical financial data in just a few clicks. Just open the sheet, grant permissions, and follow the setup steps. Once done, select a stock and instantly load up-to-date data into your sheet.
You can then create custom formulas and parameters within the sheet to personalize your analysis. The tool supports sorting, filtering, color coding, and dynamic visualizations like charts and graphs, all of which auto-update as new stock data is fetched. Get your excel geek out.
Excel Connect is available under the Data Downloader section or directly here: https://us.trendlyne.com/tools/data-downloader/trendlyne-excel-connect/
------------------------------------------------------------------------------------------------------------------------------------------
A full portfolio x-ray is here, with advanced features: Dividends, potential gain/loss, tax summary, and timeline.
We’ve rolled out several new portfolio tools to give investors better insights for both their India and US portfolios. These help you track dividends, understand potential gains and losses, assess taxes, and stay updated on key portfolio events.
The new Dividend Report provides a consolidated view of dividends received in the past year, along with upcoming dividend alerts. This helps ensure you don’t accidentally sell before the ex-dividend date.|

You can access the Dividend report using the following links:
India:
US: https://us.trendlyne.com/portfolio/dividend-report/#
The Potential Gain and Loss Report highlights your portfolio’s missed opportunities by showing unrealized profits/losses based on stock highs and lows. It’s a great tool to assess where you could optimize your strategy.

You can access the Potential Gain and Loss Report using the following links:
India:
US:
The Tax Summary gives an illustrative breakdown of your portfolio’s tax position based on your transaction history. Once your buy/sell data is imported, this tool offers a deeper dive into tax-related analysis.

You can access the Tax Summary using the following links:
India:
US:
The Portfolio Timeline keeps you updated on stock-specific events, including corporate actions, annual reports, earnings calls, analyst updates, and more, all in one place.

You can access the Portfolio Timeline using the following links:
India: https://trendlyne.com/portfolio/timeline/#analyst_insights
US: https://us.trendlyne.com/portfolio/timeline/#analyst_insights
------------------------------------------------------------------------------------------------------------------------------------------
PE valuation check - Overvalued or undervalued stocks
The PE Valuation Check helps you quickly check whether a stock is overvalued or undervalued by comparing its current valuation with historical benchmarks. It uses two key comparisons:

1. Current PE vs 5-Year Average PE – to see how the stock’s current price-to-earnings ratio stacks up against its historical average.
2. 1-Year Forward PE vs 5-Year Average PE – using projected earnings to gauge how the forward-looking valuation compares with long-term norms.
These checks help you determine if a stock is trading above or below its valuation range.
------------------------------------------------------------------------------------------------------------------------------------------
More screener enhancements!
New Technical Parameters (Weekly OHLC & Monthly OHLC)
To help Trendlyne users make more informed decisions, we’ve added new parameters across SMA, EMA, oscillators, momentum, and candlesticks for weekly and monthly timeframes.
This addition to our custom screener parameters simplifies the analysis of price trends and the identification of key market signals, helping users navigate market volatility.
By utilizing these indicators, users can better assess the strength and direction of price movements, whether focused on long-term or short-term opportunities.
To test out these new parameters:
From the ‘Screeners’ page, navigate to ‘Create New Screener’

Toggle ‘View All Parameters’

Scroll down to the ‘Suggestions’ drop-down until you come across ‘Technical - Daily OHLC’, ‘Technicals - Weekly OHLC’, and ‘Technicals - Monthly OHLC’.

Family group and Investing themes screeners
We are excited to introduce two new Stock Lists Screeners to enhance your investment research and strategy. These tools help you to track stocks more efficiently and take advantage of emerging market trends:

1. Family Group Companies Screeners: This screener monitors stocks owned by family conglomerates, including the Adani Group, Tata Group, Aditya Birla Group, and others, using specific parameters for family group companies.
2. Top Stocks Across Investing Themes Screeners: This screener highlights stock lists across major themes such as Gold, Silver, AI, PSU, and more, showcasing the top stocks within these investing themes.
These enhancements are designed to help you make informed investment decisions!
New screener categories: Intraday, Swing trading & Penny stocks
Intraday Screeners: Now track intraday moves with categories like Positive/Negative Technicals, Price and Volume breakouts, and Bullish/Bearish Candlestick patterns, all designed to catch short-term trends

Swing Trading Screeners: Find short- to medium-term trade setups with screeners based on Relative Returns, Price/Volume momentum, Candlestick patterns, and Technical signals.

Penny Stock Screeners: Discover potential breakout stocks under 100 across all indices. A new, focused category to filter and track India’s top penny stocks based on multiple technical and fundamental filters.

------------------------------------------------------------------------------------------------------------------------------------------
Starfolio update: New investment advisors are now live
We’ve expanded our Starfolio lineup with a new set of SEBI-registered advisors (RA/RIAs) now available on the platform. You can now explore portfolios and strategies from:
invest4Edu, KamayaKya, WealthTrust Capital, and ArthScience Capital
These additions bring fresh perspectives and investment strategies across different themes and risk profiles. Check them out on the Starfolio section to explore actionable model portfolios managed by experts.
------------------------------------------------------------------------------------------------------------------------------------------
PE/ PEG alerts:
You can now set PE and PEG alerts along with Price alerts! Get instant email notifications when a stock’s valuation crosses your set thresholds. Spot overvalued or undervalued opportunities and make smarter, faster investment decisions.
You can access the PE/ PEG alerts using the following links and from alert pop-up from Stock overview pages:
India: https://trendlyne.com/alerts/
US: https://us.trendlyne.com/
------------------------------------------------------------------------------------------------------------------------------------------
6th December, 2024
Excel Connect:
Excel Connect is a product we are pretty excited about, because of how easy it makes stock analysis. This is a first in India product.
Excel Connect lets you access financial data for any listed stock, through an interactive Excel sheet or Google Sheet.

Fetch the Latest and Historical Financial Data into Excel
Getting the latest financial information into Excel is pretty easy. Simply open the sheet, grant the necessary permissions, follow the initial setup instructions.
Once that is done you can select any stock, and the sheet loads up-to-date financial data.
Create Your Own Custom Formulas and Parameters
Now that you have this data, you can create your own parameters and formulas inside the Excel worksheet.
Sort, Filter, and Visualize Data
There are other ways you can power up your analysis with Excel Connect. You can easily add color coding, sorting, and visualizations such as charts and graphs.
And as you fetch new stock data, your formulas and rules automatically refresh, so your analysis is always up-to-date.
Excel Connect is available in the Data Downloader section. Please note that only StratQ subscribers can generate tokens to access the latest data within the file.
------------------------------------------------------------------------------------------------------------------------------------------
New Portfolio Improvements:
Fix portfolio problems early: Deep Dive launched in the Portfolio Report
The Deep Dive section of the Portfolio Report is very useful for finding hidden problems and red flags in your equity portfolio. It gives you a detailed analysis of each portfolio stock, helping you make more informed decisions with insights into important metrics, such as Stock Score, Valuation Ratios, and Risk Analysis.

1.Stock Score: The Stock Score checks the performance of your portfolio stocks, calculated as a weighted average of individual Trendlyne stock scores.
Each stock’s individual score and its contribution to the portfolio score are displayed, making it clear which stocks contribute most to your portfolio's strength.

2.Valuation PE Ratios: This compares your portfolio's valuation with market benchmarks. It offers a breakdown of each stock's contribution percentage, Price-to-Earnings (PE) Ratio, and Price-to-Book (PB) Ratio.

3.Valuation PEG Ratios: This metric compares your portfolio's PEG ratio to the Nifty 50 index, assessing valuation based on growth expectations.
Each stock's contribution percentage, PEG ratio, and Dividend Yield are here, with insights into growth potential relative to valuation, and income generated through dividends.

4.Risk Analysis: This measures your portfolio's volatility compared to the market. Detailed metrics, including each stock’s Beta, Standard Deviation, Sharpe Ratio, and Value at Risk (VaR), x-rays your portfolio volatility.

------------------------------------------------------------------------------------------------------------------------------------------
Investment and Financials Data Export in Portfolio:
We noticed that our users like our portfolio report tab. To make portfolio analysis even easier, we have introduced the Data Export feature.
With this feature, Trendlyne users can download an Excel sheet with detailed information about their equity portfolio including:
- Investment Details: This has financial metrics such as the sector and industry of your investments, the invested amounts, average buy price, stock quantity, current investment value, day change %, day P&L, and unrealized P&L.
- Fundamental Analysis: Includes metrics like Trendlyne DVM scores, Market cap, operating revenue growth %, PE ratio, Piotroski score, net profit growth %, Forecaster estimates, dividend yield %, etc.
Go to the portfolio report section to get this report.

Then Click on ‘Portfolio Data Export’ and the file will automatically be saved to your downloads folder.

------------------------------------------------------------------------------------------------------------------------------------------
Mutual Fund Sync for customers using Zerodha:
Trendlyne has expanded its services for Zerodha customers, enabling them to import mutual fund holdings along with stock data. This feature lets you compare mutual funds and stocks on a single platform.
To get started, visit the ‘Import Portfolio’ page and select 'Zerodha'.

Choose ‘Mutual Funds’ in the pop-up:

Then, log in to your Zerodha account to link it with Trendlyne.
------------------------------------------------------------------------------------------------------------------------------------------
Portfolio Ledger:
With Trendlyne’s new portfolio ledger, users can see all transactions across their demat accounts in one place. You can sort by transaction date, type, quantity, and price. This makes portfolio management easier, and gives you an organized view of your investment history.
To access this feature, click on ‘Ledger’ from the ‘Portfolio’ view:

------------------------------------------------------------------------------------------------------------------------------------------
15th July, 2024
TradingView charts for Trendlyne customers
Trendlyne has recently enhanced its offerings by integrating TradingView charts, one of the most widely-used, advanced charting tools in the financial market. This integration significantly upgrades Trendlyne's capabilities, providing users with sophisticated graphical analysis options and customizable features. TradingView charts are known for their extensive range of indicators and charting tools, which cater to both novice and professional traders.
With this integration, Trendlyne users can access detailed price graphs, perform trend analysis, create personalized trading strategies, and apply technical analysis tools across various chart types.
To access the TradingView chart, follow these steps:
Select any stock and navigate to the chart section.
Click on 'Switch to TradingView' to access the 'TradingView' charts.

Default Chart

TradingView Chart
------------------------------------------------------------------------------------------------------------------------------------------
6th June, 2024
Enhanced Data Downloader

We have upgraded the 'Data Downloader' feature with a new look and feel. The Data Downloader now allows you to download data for reports from the Stock Data Downloader, F&O Data Downloader, and Portfolio Downloader from a single place.
After selecting the groups and your preferred metrics, click on 'Download Data' to download the file in Excel format.
In the Stock Data Downloader, you can select up to two stock groups or 1,000 stocks, and up to three metric lists or 90 characteristics at once. Click on 'Download Data' to get the file in Excel format.

With F&O Data Downloader, you can download comprehensive F&O data points including OI, PCR, Rollover data and more for Indices and Stocks

In the Portfolio Downloader, you can download comprehensive holding details including Quantity, Buy Price, PnL, Trendlyne scores, Relative performance, financial data and more.

------------------------------------------------------------------------------------------------------------------------------------------
15th May, 2024
Woodie's, Camarilla, and Fibonacci Pivots

We have added Woodie's, Camarilla, and Fibonacci pivots to the Stock Technical section. These additional pivot points will help better understand potential price resistances and supports.
Woodie's Pivot Points: Calculated using the previous trading day's high, low, and close prices. The pivot point is the average of these values, with additional support and resistance levels derived from it.
Camarilla Pivot Points: Based on the previous trading range, these pivot points highlight important price levels within the range, helping to identify potential reversal or breakout points.
Fibonacci Pivot Points: Derived from Fibonacci retracement levels, these pivot points use Fibonacci ratios to identify potential support and resistance levels.
With these new additions, you can incorporate more pivot point strategies into your trading decisions.
Happy analyzing!
------------------------------------------------------------------------------------------------------------------------------------------
24th April, 2024
AI Summary for Earnings Calls


Introducing our newest feature: AI Summary for Earnings Calls. AI summaries provide an intelligent, concise report from earnings calls transcripts, helping customers quickly understand key points and make informed decisions without having to listen to the entire call.
Powered by our AI algorithms, the AI summary extracts crucial information and highlights from earnings calls, offering you the key takeaways, forward-looking statements and red flags/risk analysis. Keep in mind that the summary may not cover all points mentioned by the management/analysts in the earnings call, since these are necessarily concise. AI summaries are available only for calls with the pdf transcript.
To access AI Summaries for earnings calls, follow these steps:
Navigate to Trendlyne's Results page.
Click on Conference/Earnings Calls.
Locate the earnings call transcript of the stock you're interested in the ‘AI Summary’ section.
